

A recent exchange in the PP2030 metrics committee was the impetus for creating this document on using metrics not only for capturing the current state of a system but also to help to improve quantitative forecasting – and the limitations of such approaches.
Many of the initiatives and technologies that are suitable to help the planet will be long running and require perseverance to complete and verification of their effectiveness, direction and expected future progress. This is where metrics come into play, which can be used to take an inventory of current achievements and give an indication on the expected future trajectory, i.e. forecast what is still to come. While providing valuable project management information (progress achieved and outlook) such data can also be utilized to communicate progress and what can be expected to larger audiences, helping to keep motivation for continuation high.
Lagging and Leading metrics
Metrics can be differentiated into lagging and leading metrics. While this document stays fairly close to the definition used in [1] it gives it a certain spin to improve the fit of the approach with the forecasting context.
- Lagging metrics are metrics that describe what has been achieved
- Leading metrics are metrics that provide insights into the expected evolution of the system
For illustrative purposes consider the example of an object that is moving along a single dimension. The main “achievement” (lagging) metric here is the distance travelled. The leading metric coming immediately to mind is the speed of the object, which provides an easy way to forecast the position of the object:

The above thought can immediately be extended to another leading metric, the acceleration (a), which is the change of speed over time.

and thus

_____________________
1 Symbols used in the formulas in this section:
- s(t): distance travelled as a function of time
- s0: starting distance
- v(t): speed of travelling as a function of time
- v: speed of travelling
- v0: initial speed of travelling
- a: acceleration
- t: time since start
This simple example also immediately highlights that such systems have forecasting power only for as long as the system is in a stable state, which in the above example is the time during which the acceleration is constant which can only be achieved for a limited time.
Dependent on the question, leading and lagging metrics may also change roles to a certain extent, i.e. what is a leading metric in one scenario, may be a lagging metric in another scenario. In the above example considering the speed as the lagging metric is a well imaginable scenario and depends on the kind of question being asked respectively on the position in the overall target hierarchy (coming back to that later in the section “Structuring metrics”)
The example provided above is clearly very simplified due to 2 reasons:
- The leading metric(s) can be derived mathematically (they are the derivative(s) of the lagging / first leading metric)
- There is a very simple structure of leading metrics to come to the lagging metric.
- Please note: All the metrics included are purely quantitative metrics – which works great in the example above but is infeasible to persist as soon as humans get into the picture.
In more realistic cases multiple leading metrics can be expected to have an impact on the lagging metric and the relationship is not as simple as just building the integral over time to come from leading to lagging metrics.
Incorporation of semi-quantitative / qualitative metrics
Not everything lends itself towards being represented by a number naturally. There are some things that are not even close to being represented by a number – like the enthusiasm for engaging in the limitation of global warming in society – and there are other things that may be representable by a numeric metric but are difficult to properly measure.
Despite these aspects being difficult to capture in a number there are techniques that enable high quality numeric representation, be it in the way of a maturity level / technology readiness level, via surveys or in the use of proxy measurements.
An example of a maturity level is provided in [3], which explains TM Forum’s approach towards assessing the progress of an organization towards achieving autonomy in its operation. For this purpose, it defines maturity levels from 0 (Manual Operation & Maintenance) to 5 (Full Autonomous Network) which are qualitatively described. Finding the maturity of an organization therewith typically requires a manual assessment of the operation. This also introduces a certain level of subjectivity into this assessment. Nevertheless, given a good definition of the maturity levels and alignment between assessors, good consistency can be achieved. This is even more the case if the same entity is assessed by the same assessor at different points in time to capture progress, which can be expected to be the dominant approach when used for forecasting purposes.
Surveys can be used to help quantify the sentiment of a population towards a certain topic (e.g. electric vehicles or long-distance flying). It needs to be considered that, while surveys are an important tool, the result can be heavily impacted by seemingly small changes in wording and events that appear unrelated.
_____________________
2 TM Forum’s name was Tele-Management Forum until 2008. TM Forum is a global industry association for service providers and their suppliers in the telecommunications industry – https://www.tmforum.org/.
Proxy measurements are measuring something to get a quantitative representation of something else (that would be more difficult or impossible to measure directly). Analysis of (public) posts on social media to get hold of the mood of the population related to ecological risks can be considered as one example of a proxy measurement (e.g. by counting the number of appearances of certain words). What needs to be considered is that the relation of the proxy to the target may be different in different cultures and change over time.
In the example of analyzing social media posts, changes in language use over time may need to be considered, which can be facilitated by translating the raw proxy measurement into a more abstract metric (similar in approach to a maturity level) with the translation rule being updated to the culture and the evolution of language used within this culture.
Combination with statistics / AI
Use of statistics / AI for metric selection
If a good volume on measurements does already exist when the analysis framework is being set up, AI (and I am thinking predominantly about the machine learning type of AI here – see [4] for a differentiation of types of AI) can be used to identify relationships between different metrics on a statistical basis (treated in depth in section 9 of [2]).
Relationships to be understood as how much of the behavior of the dependent variable (which translates into the lagging metric) can be explained by the independent variable. Those that have high explanatory value will then become the independent variables respectively the leading metrics when translated into the metrics domain.
The usual word of caution when talking regression and correlation: just because two variables (metrics) are highly correlated does not necessarily mean that one is driving the other (having a causal relationship); typically, only those metrics where there is also a cause/effect relationship qualify being represented as leading/lagging metrics.
Such a cause/effect relationship can be derived from physics (the position/speed/acceleration example from section “Lagging and Leading metrics” is a good example for that), timing (one event [change in acceleration] precedes another [change in speed]), psychology etc. but should never just be assumed by two metrics being correlated.
To summarize: statistics / AI can be used to choose a good set of leading metrics for a given lagging metric if enough historical data is available for analysis.
Use of statistics / AI for forecasting
With a regression model being created this model can also be used to forecast the evolution of the lagging metric(s). Using a regression model depends on the continuation of the underlying principles. While the physical relationships that are underlying the position/speed/acceleration example from
_____________________
3 The conceptual thinking leading to the differentiation into “dependent” and “independent” variable comes from the assumption that there is a causal relationship between the two (or more) variables which leads to the dependent variable being explainable as a function of one or multiple independent variables.
In the example of the initial paragraph / Formula 1 s(t) is the dependent variable, while v and t are the independent variables (with s0 being a parameter).
section “Lagging and Leading metrics” are extremely unlikely to change the same cannot be said in any environment that is impacted by human behavior, politics but also technological progress. Thus, caution needs to be applied if such models are used for forecasting in such domains.
An alternative to regression models for forecasting is the use of generative AI [5]. This type of AI can generate new insights that the AI has not been (exactly) trained on; because of that property the AI is conceptually capable of dealing with circumstances breaking with historical precedents. Nevertheless, caution needs to be applied when using generative AI as these models typically do not provide the logic leading to the results as well as such models sometimes provide non-reality related results (which would be considered hallucinations in case of Large Language Models (LLMs)).
Structuring metrics
The example provided in section “Lagging and Leading metrics” is a simple one, chosen for its simplicity. Moving towards the environment the potential relationships quickly become more complex.
Figure 1 shows a partial hierarchy of metrics that can be applied to global warming. While top level relationships could be considered to be outside of simple metrics based forecasting there are already good and widely accepted targets on CO2, Methane, … concentration etc. available that are expected to lead to acceptable global warming (e.g. 1,5°C as defined by COP21 in Paris).

Figure 1 – Metrics Hierarchy
_____________________
4 While LLMs are the most popular kind of generative AI, several other kinds of neural networks are also falling into this category. With the metrics topic being focused more on numbers than words LLMs are unlikely to be the most appropriate tool to handle this kind of tasks.
5 All metric hierarchies shown in this post are intended to visualize the concepts of metrics and forecasting and are not necessarily directly useable. The creation of a metrics hierarchy for an entity would need to be aligned with the specific needs and properties of this entity and cannot be generalized into a text like this.
At the lower tiers of the hierarchy (and the hierarchy can be extended by several more levels) metrics typically do not provide metrics-based forecasting covering the whole globe but rather focus on reasonably small entities, like a city.
For the example of a city consider a city (lets call it Paris as a concrete example) which is trying to evolve towards having as many touchpoints in a 15-minute walking distance as possible, facilitate the use of public transportation and reduce the impact of the remaining travel in individual vehicles.
For such an example the focus is on one of the endpoints shown in Figure 1, the amount of CO2 generated by traffic in a city. This example is further broken down in Figure 2. This breakdown allows for a distribution of responsibility of the overall traffic generated CO2. While responsibility for the top level will have to reside on the leadership for the city, contributing metrics can be delegated to sub-organizations, e.g.:
- Distance travelled:
- city planning to create an environment that is friendly towards CO2 efficient means of movement (walking, biking, public transportation).
- Public transportation:
- public transportation utility to optimize the CO2 intensity (CO2 created per passenger km) while increasing the attractiveness of public transportation.
- Individual transportation:
- city planning to avoid creating situations where the use of transportation means with high CO2 intensity appears to be the most logical (or even only feasible) way
- finance to create incentives towards low CO2 intense vehicles (which can e.g. be done by providing financial aid for such vehicles and/or by charging high CO2 intense vehicles for the indirect cost they are causing).
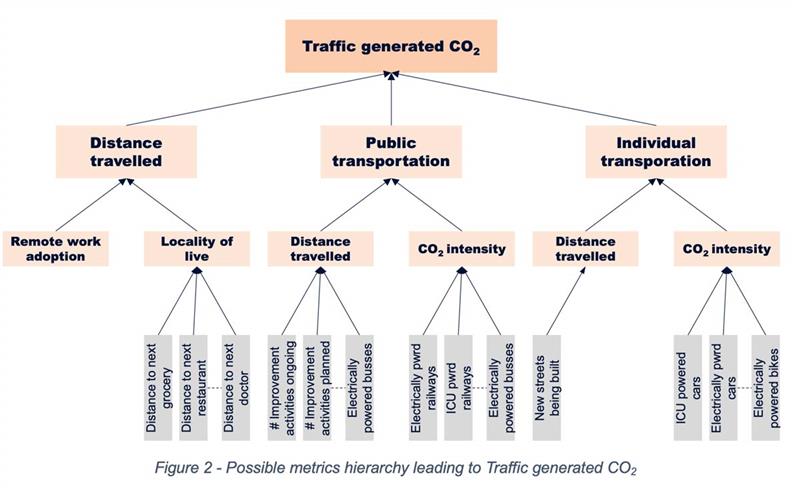
Figure 2 – Possible metrics hierarchy leading to Traffic generated CO2
In many cases lower levels of such a hierarchy are leading metrics for the metrics on the higher levels, e.g. the distance travelled by public transportation (passenger kilometers) can be seen as a lagging metric with leading metrics being the attractiveness of public transportation, which is going to be impacted by improvement activities.
Another example is an improvement of the street system (e.g. a new highway is being built, adding capacity) this can be seen as a leading indicator to the distance being travelled by individual transportation, because individual transportation is going to benefit more from speed increases than public transportation, making individual transportation more attractive.
Tracking progress using metrics
With a suitable metrics hierarchy being created the next step is the definition of a set of target values for these metrics. The headline metrics are likely to be lagging metrics on the higher levels of the hierarchy. Nevertheless, when designing the targets, care needs to be taken, so that the corresponding leading metrics required to achieve the top-level targets are feasible.
While executing the plan that is reflected in the targets, the lagging metrics are mainly looking backwards and reflecting the achievements already accomplished. While achieving these targets is a necessary condition for claiming (longer-term) success the leading metrics need to be checked/tracked as well to ensure that the foundation has been laid for continuation of this trend.
To use one of the topics from the last section as an example: While the portion of passenger kilometers travelled by public transportation in the current period may be according to plan and show a significant improvement from the previous period, this by itself doesn’t lend itself towards simple extrapolation of the trend if there is a lack of improvement activities that can be expected to support the continuation of this increase, like additional trains/buses (to avoid crowding and improve waiting times).
Limitations
Like all forecasting there are some severe limitations. One of the most important is a limitation on how far into the future ‘valid’ forecasts can be provided. For this forecasting approach this depends on the time delay that is typically observed between an event that is represented in a leading metric and the completion of the reaction of the corresponding lagging metric. Different leading metrics will have different delays, and in a scenario where multiple leading metrics are having an impact on a lagging metric the further out into the future a forecasting attempt is being made the less current values of leading metrics are going to have an impact on the future situation.
Considering the situation depicted in Figure 3 with
-
-
- 3 leading metrics having an impact on one lagging metric
- the values of all metrics available from the past until T0
- the impact of leading metric 1 ceasing after a time T1
- the impact of leading metric 2 ceasing after a time T2
- the impact of leading metric 3 ceasing after a time T3
-
Forecasting the evolution of the lagging metric will be possible with gradually reduced certainty (depicted by different shades of green in Figure 3) until T3. Any forecasts for times after T3 would require the ability to provide forecasts for at least one of the leading metrics – which nevertheless introduces additional uncertainties in the overall structure.

Figure 3 – Forecasting power of leading metrics
The other limitation of this kind of forecasting is caused by the incomplete explanatory power that the leading metrics are most likely possessing, i.e. the behavior of the lagging metric can only partially be explained by the leading metric(s) that are part of the setup, leaving a part of the behavior being subject to “other aspects” that are not known or considered in this setup, introducing a base level of uncertainty of the forecasts that applies to the period from T0 to T1.
References
-
-
- Leading vs. Lagging Indicators; Audrey Xu; Amplitude.com
- OpenIntro Statistics; 2nd Edition; David M. Diez, Christopher D. Barr, Mine Çetinkaya-Rundel
- IG1193 Cross-Industry Autonomous Networks – Vision and Roadmap, TM Forum
- AI-What AI; Ronald Hasenberger; Linked In
- Generative AI; Wikipedia
-

Author Bio
Ronald Hasenberger is a Principal Consultant at Bell Labs Consulting working on Operations and Transformation in the ICT environment. He can be reached at linkedin.com/in/ronaldhasenberger.
_____________________
6 In this example 3 leading metrics have significant impact on the lagging metric. After T1 the relevant values for one of these metrics is no longer known thus introducing additional uncertainty into the prediction as the full possible range for this metric needs to be considered as a possible input.
7 In almost all practical cases the consideration of all leading metrics that are known to be impacting the lagging metric(s) can be considered infeasible due to the amount of metrics that would need to be followed up on – and at some point you will be faced with fundamental limitations based on quantum theory (when assessing physical systems).
Disclaimer: The thoughts/opinions expressed in this document are my own and do not necessarily align with those of my employer or the IEEE.
